| View previous topic :: View next topic |
| Author |
Message |
InternalError
Newbie cheater
![]() Reputation: 0 Reputation: 0
Joined: 23 Mar 2023
Posts: 12
|
 Posted: Thu Mar 23, 2023 3:40 pm Post subject: Error with attach debugger Posted: Thu Mar 23, 2023 3:40 pm Post subject: Error with attach debugger |
 |
|
I try to attach debugger to the program with some anti-debug protection(KM protection). I unprotected the process handler, but anyway get the errors. If i run this program with out protector, debugger (im use DBVM level) works ok. I want to understand what is the problem. Error messages are TOO vague...
When I press attach to protected process i get "Access Violation". BUT! CE stops working correctly. After this, CE says DBK Error: "Access Violation" to any process... Ok, i restart CE.. At startup he says "The driver couldnt be opened! Its not loaded or not responding. I recommended to reboot your system and try again". Protection breaks CE??
|
|
| Back to top |
|
 |
Dark Byte
Site Admin
 Reputation: 470 Reputation: 470
Joined: 09 May 2003
Posts: 25812
Location: The netherlands
|
| Posted: Fri Mar 24, 2023 6:26 am Post subject: |
|
|
likely it blocks dbk and process opening
but what you could do is load dbvm, disable all ketnel options close ce, unload the driver and start ce again
with dbvm loaded you can still access a process using it's cr3 value. dbvm has a cr3 logger . so log some, then query all results for some information to figure out which one is correct
then with that you can do memory reads and find what access/writes using dbvm
(i could probably make a cr3 processpicker in ce/ce lua which then works as a normal opened process)
_________________
Do not ask me about online cheats. I don't know any and wont help finding them.
Like my help? Join me on Patreon so i can keep helping |
|
| Back to top |
|
|
InternalError
Newbie cheater
![]() Reputation: 0 Reputation: 0
Joined: 23 Mar 2023
Posts: 12
|
| Posted: Fri Mar 24, 2023 7:32 am Post subject: |
|
|
Ok, after some cycles of stop/start cedriver73 I was able to connect the debugger xD. Hope I can do it again..  I would also like to know more about cr3.. how to apply it with CE? Because I have to patch some stuff in kernel memory to unlock the process handle. This is a bad way. I don't know much about how debuggers work. And yet, is there an opportunity in the dbvm-level debugger to debug kernel functions step by step? I do not quite understand how I could put a hardware breakpoint in kernel space I would also like to know more about cr3.. how to apply it with CE? Because I have to patch some stuff in kernel memory to unlock the process handle. This is a bad way. I don't know much about how debuggers work. And yet, is there an opportunity in the dbvm-level debugger to debug kernel functions step by step? I do not quite understand how I could put a hardware breakpoint in kernel space
|
|
| Back to top |
|
|
InternalError
Newbie cheater
![]() Reputation: 0 Reputation: 0
Joined: 23 Mar 2023
Posts: 12
|
| Posted: Sat Mar 25, 2023 4:32 pm Post subject: |
|
|
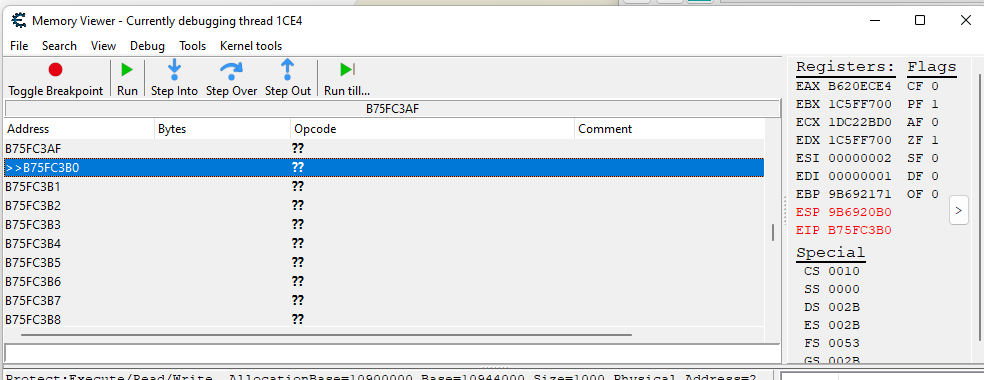
So, I noticed that debugging don't correct works in kernel mode. Me need to trace some simple IRP routines. Breakpoint hits and "step by step" are works, but debugger shows strange information
| Description: |
|
| Filesize: |
23.83 KB |
| Viewed: |
3347 Time(s) |
|
|
|
| Back to top |
|
|
InternalError
Newbie cheater
![]() Reputation: 0 Reputation: 0
Joined: 23 Mar 2023
Posts: 12
|
| Posted: Sun Mar 26, 2023 2:00 pm Post subject: |
|
|
If anyone encounters a similar problem, then this is due to the fact that the debugger is attached to the wow64 process. Change the context to any x64 application and everything will work.
Problem solved.
|
|
| Back to top |
|
|
|

